Table of Contents
Introduction
Financial statements are formal records that show the financial performance and financial position of a business over a specific period. They help business owners, investors, managers, and government authorities understand how a company is performing financially.
Financial statements are usually prepared according to accounting standards such as Generally Accepted Accounting Principles (GAAP) or International Financial Reporting Standards (IFRS).
The main purpose of financial statements is to provide clear information about income, expenses, assets, liabilities, and cash flow, allowing stakeholders to make informed business decisions.
Main Types of Financial Statements
| Financial Statement | Purpose | Key Information Provided |
|---|---|---|
| Income Statement | Shows company profit or loss | Revenue, expenses, net income |
| Balance Sheet | Shows financial position | Assets, liabilities, equity |
| Cash Flow Statement | Shows movement of cash | Operating, investing, financing cash |
| Statement of Changes in Equity | Shows changes in ownership equity | Capital, retained earnings |
These statements together provide a complete overview of a company’s financial health.
Income Statement (Profit & Loss Statement)
| Component | Description | Example |
|---|---|---|
| Revenue | Money earned from sales | $100,000 |
| Cost of Goods Sold | Cost of producing products | $40,000 |
| Gross Profit | Revenue – COGS | $60,000 |
| Operating Expenses | Rent, salaries, utilities | $25,000 |
| Net Profit | Final earnings after expenses | $35,000 |
The income statement measures a company’s profitability over a specific period such as monthly, quarterly, or annually.
Balance Sheet Structure
| Section | Components | Purpose |
|---|---|---|
| Assets | Cash, inventory, equipment | Resources owned by company |
| Liabilities | Loans, accounts payable | Company obligations |
| Equity | Owner capital, retained earnings | Owner’s share in business |
The balance sheet follows the accounting equation:
Assets = Liabilities + Equity
This statement represents the financial position of the company at a specific point in time.
Cash Flow Statement Breakdown
| Section | Description | Example |
|---|---|---|
| Operating Activities | Cash from core business operations | Cash from product sales |
| Investing Activities | Cash from investments | Purchase of equipment |
| Financing Activities | Cash related to funding | Loans or shareholder capital |
The cash flow statement helps determine whether a company has enough cash to operate effectively.
Statement of Changes in Equity
| Component | Explanation |
|---|---|
| Owner Capital | Initial investment |
| Additional Investment | Extra funds invested |
| Net Profit | Profit added to equity |
| Withdrawals | Money taken by owners |
| Retained Earnings | Profits kept in business |
This statement tracks how the ownership value of a business changes over time.
Key Components of Financial Statements
| Component | Explanation |
|---|---|
| Revenue | Income generated from business activities |
| Expenses | Costs incurred to operate the business |
| Assets | Economic resources owned |
| Liabilities | Financial obligations |
| Equity | Owner’s claim on company assets |
These components form the foundation of financial accounting and reporting.
Financial Statement Users
| User Type | Purpose |
|---|---|
| Investors | Evaluate profitability and growth |
| Creditors | Assess repayment ability |
| Managers | Make operational decisions |
| Government | Tax and regulatory monitoring |
| Employees | Understand company stability |
Different stakeholders rely on financial statements to evaluate company performance.
Financial Ratios Table
Financial ratio analysis is strongly related to financial statements, and Google expects it in detailed articles.
| Ratio Type | Formula | Purpose | Ideal Range |
|---|---|---|---|
| Current Ratio | Current Assets / Current Liabilities | Measures short-term liquidity | 1.5 – 2 |
| Debt to Equity | Total Liabilities / Shareholder Equity | Measures financial leverage | < 2 |
| Gross Profit Margin | Gross Profit / Revenue | Shows profitability from sales | 40–60% |
| Net Profit Margin | Net Profit / Revenue | Overall profitability | 10–20% |
| Return on Assets | Net Income / Total Assets | Efficiency of asset usage | 5–20% |
Real Company Financial Statement Example
Example:
| Financial Item | Value Example |
|---|---|
| Revenue | $394 Billion |
| Net Income | $99 Billion |
| Total Assets | $352 Billion |
| Total Liabilities | $290 Billion |
Example company: Apple Inc.
Financial Statement Preparation Tools
Software is used to prepare financial statements.
| Software | Best For | Pricing |
|---|---|---|
| QuickBooks | Small businesses | $30/month |
| Xero | SMEs | $15–$78/month |
| SAP ERP | Large companies | Custom pricing |
| Microsoft Excel | Manual accounting | Free with Office |
Financial Statements vs Accounting Reports
| Feature | Financial Statements | Accounting Reports |
|---|---|---|
| Purpose | External reporting | Internal analysis |
| Frequency | Quarterly / Annual | Daily / Monthly |
| Audience | Investors, regulators | Managers |
| Regulation | Strict accounting standards | Flexible format |
Common Financial Statement Errors
This is very useful and practical.
| Error | Impact |
|---|---|
| Incorrect revenue recognition | Overstated profits |
| Missing liabilities | Misleading financial position |
| Calculation errors | Incorrect reporting |
| Improper asset valuation | Distorted balance sheet |
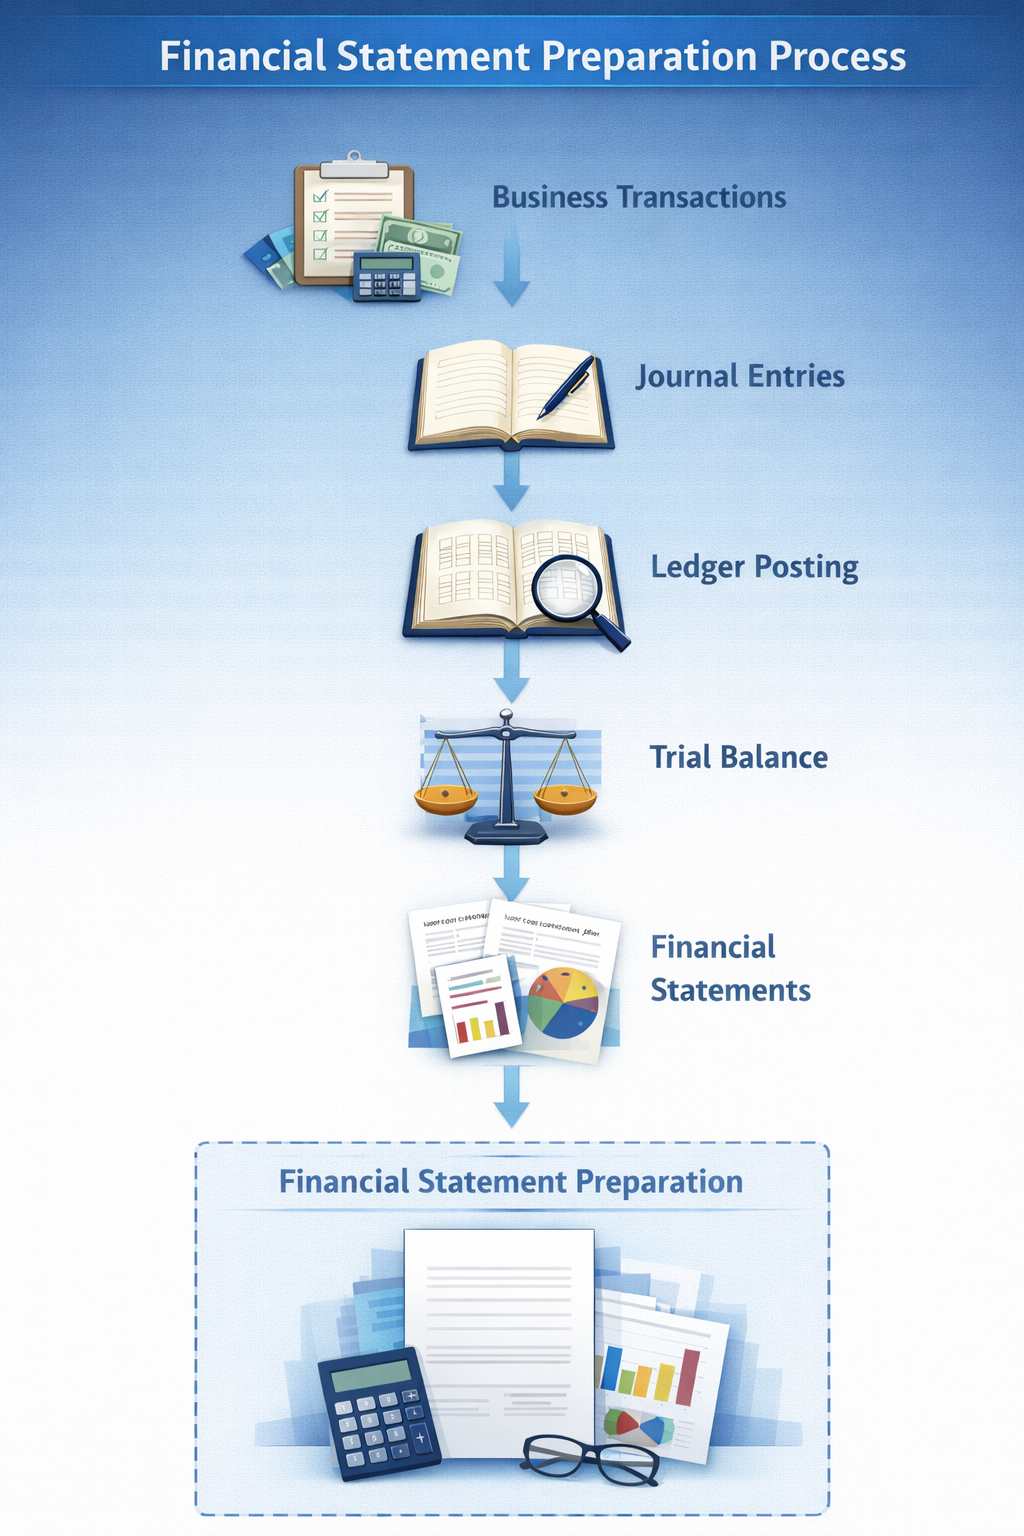
Financial Statements Workflow Diagram
Advantages and Limitations of Financial Statements
| Advantages | Limitations |
|---|---|
| Provide clear financial information | Based on historical data |
| Help investors make decisions | Can be affected by accounting policies |
| Useful for financial analysis | Does not capture non-financial factors |
| Required for regulatory reporting | May involve estimation errors |
Despite limitations, financial statements remain the most reliable financial reporting tools.
How Businesses Prepare Financial Statements

| Step | Process |
|---|---|
| Step 1 | Record business transactions |
| Step 2 | Prepare journal entries |
| Step 3 | Post entries to ledger |
| Step 4 | Prepare trial balance |
| Step 5 | Generate financial statements |
These steps follow the standard accounting cycle used by businesses worldwide.
Financial Statement Analysis Methods
| Analysis Method | Purpose |
|---|---|
| Ratio Analysis | Measure financial performance |
| Trend Analysis | Evaluate growth over time |
| Comparative Analysis | Compare with competitors |
| Vertical Analysis | Analyze percentage of total items |
Financial analysis helps stakeholders interpret financial statements more effectively.
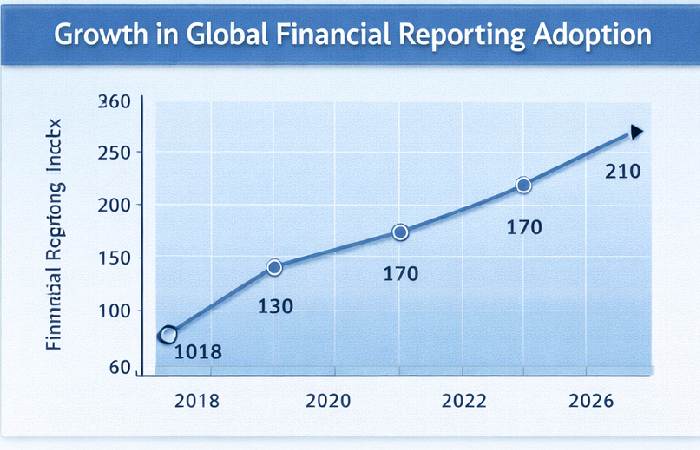
Growth in Global Financial Reporting Adoption
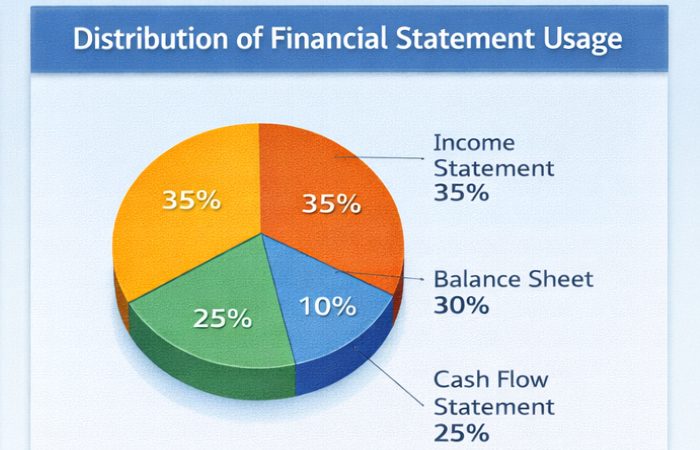
Distribution of Financial Statement Usage
FAQs
What are financial statements used for?
Financial statements are used to evaluate the financial performance and financial position of a business.
How many main financial statements are there?
There are four main financial statements: income statement, balance sheet, cash flow statement, and statement of changes in equity.
Who prepares financial statements?
Accountants or financial professionals prepare financial statements based on company financial records.
Why are financial statements important for investors?
They help investors analyze profitability, financial stability, and potential risks before investing in a company.
How often are financial statements prepared?
Businesses usually prepare financial statements monthly, quarterly, and annually depending on reporting requirements.
Conclusion
Financial statements play a crucial role in understanding the financial health and performance of any business organization. They provide structured information about income, expenses, assets, liabilities, and cash flows, allowing stakeholders to evaluate profitability, financial stability, and operational efficiency. The main financial statements—income statement, balance sheet, cash flow statement, and statement of changes in equity—work together to present a complete financial picture of a company. By analyzing these reports using various financial analysis methods, investors, managers, and regulators can make informed decisions that support sustainable business growth and financial transparency.